


Next: 4 Organic Radicals
Up: EPR Tutorial
Previous: 2 Objectives
Contents
3 Theoretical basis. Spectrum of a free electron
An electron is a charged particle that has an angular momentum of spin with a quantum number of spin,
 , and an associated magnetic moment.
In the presence of an external magnetic field,
, and an associated magnetic moment.
In the presence of an external magnetic field,  , the electronic energy is:
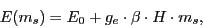 |
(1) |
where  is the energy in absence of the magnetic field;
  , an dimensionless constant,
is the Landé g factor for a free electron whose value is 2.002319;
, an dimensionless constant,
is the Landé g factor for a free electron whose value is 2.002319;
 is the Bohr magneton, 9.274
 10
10 JT
JT ;
is the external magnetic field in Tesla
and
;
is the external magnetic field in Tesla
and  is the magnetic quantum number,
  .
.
In an EPR experiment, the transition between two Zeeman states ( and
and  )
generated by a strong magnetic field is induced by means of a radiation of microwave frequency
)
generated by a strong magnetic field is induced by means of a radiation of microwave frequency
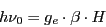
 which determines the ''resonance condition'':
 |
(2) |
that replacing in Eq. (1) yield:
 |
(3) |
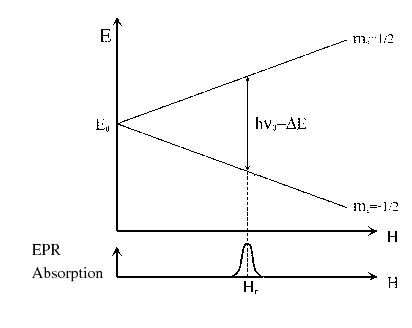
The energy diagram and the EPR spectrum of a hypothetical free electrons are shown
in the Fig. 1.
In the diagram, the absorption is represented against the magnetic field,
because the conventional equipment usually works with a fixed frequency
and variable magnetic field.
The resonance condition or the absorption will be obtained increasing the value of
until the Eq. (3) is fulfilled.
The magnetic field corresponding to the absorption is denominated resonance field,  .
.
Figure 1:
Electronic Zeeman splitting and EPR absorption spectrum of a free electron.
 |
The separation between the energy levels is a linear function of the applied magnetic field (see Eq. (3)
and Fig. 1).
The spectrometers of Electron Paramagnetic Resonance denominated of ''X-band''
have a frequency of 9.5 GHz that correspond to  340 mT (3400 G)1.
The spectrometers called of ''Q-band'' have a frequency of 34 GHz ( 1250 mT).
340 mT (3400 G)1.
The spectrometers called of ''Q-band'' have a frequency of 34 GHz ( 1250 mT).
Next: 4 Organic Radicals
Up: EPR Tutorial
Previous: 2 Objectives
Contents
Universidad Autónoma de Madrid, Departamento de Química Física Aplicada