Next: 5.1.1 Hydroxymethyl neutral radical
Up: 5 Radical Spectra with
Previous: 5 Radical Spectra with
Contents
5.1 Radicals containing n equivalent nuclei with I = 1/2
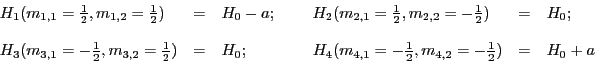
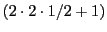
The energy diagram and the EPR spectrum of a radical that contains a nucleus with  and an unpaired electron are showed in Fig. 2.
Both resonance fields ( and
and  ) are deduced from Eq. (5) replacing
  by
by  and
and  :
:
Figure 2:
Energy levels of a radical with a nucleus with I = 1/2 and its corresponding EPR spectrum.
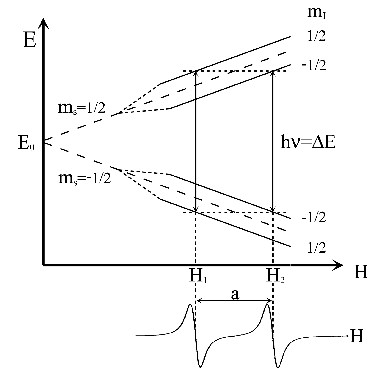 |
The spectrum consists of two lines of equal intensity (1:1) called doublet.
The separation between these two lines of the doublet is the hyperfine splitting a.
Usually in EPR spectroscopy the first derivative of the absorption curve is represented.
This is showed in the lower part of Fig. 2.
If a radical contains  equivalent nuclei (identical chemical surrounding) of spin
  they will give the same hyperfine splitting (equal value of a);
its EPR spectrum will be formed by
they will give the same hyperfine splitting (equal value of a);
its EPR spectrum will be formed by  equidistant lines to the resonance fields:
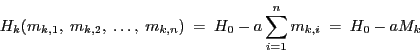 |
(6) |
where  are the quantum numbers corresponding to the Z component of the angular momentum
of nuclear spin of each nucleus
are the quantum numbers corresponding to the Z component of the angular momentum
of nuclear spin of each nucleus  in the state
  .
It should be noted that we have eliminated the subscript in to simplify the nomenclature.
.
It should be noted that we have eliminated the subscript in to simplify the nomenclature.
 it is the quantum number corresponding to the total Z component of the angular momentum of nuclear spin.
It is the sum of the individual Z components
it is the quantum number corresponding to the total Z component of the angular momentum of nuclear spin.
It is the sum of the individual Z components  of each equivalent nucleus for a certain state.
There are
of each equivalent nucleus for a certain state.
There are  nuclear spin states and, therefore, there are different
possibilities for .
Nevertheless, the EPR spectrum has only resonance fields or
nuclear spin states and, therefore, there are different
possibilities for .
Nevertheless, the EPR spectrum has only resonance fields or  lines.
For example, a radical with two equivalent protons (n = 2) has
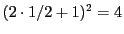 possibilities:
However, as we indicated above, there are only different resonance fields, i.e. different lines of EPR;
because all lines excepting the first and the last one are degenerated (same position)
and their relative intensities increase towards the centre of the spectrum.
In the example of two protons there are only three different lines
 .
The resonances and
.
The resonances and  are degenerated and the intensity of this line is double of that of and
  .
The spectrum is a triplet of relative intensities 1:2:1 and the separation between two consecutive lines
is the hyperfine splitting
.
The spectrum is a triplet of relative intensities 1:2:1 and the separation between two consecutive lines
is the hyperfine splitting  (see fig. 3).
The relative intensities for nuclei with spin are given by the coefficients of the binomial
 that can be obtained easily from the Triangle of Pascal (Table 2);
where each number is equal to the sum of the two numbers placed over it.
In Table 2,
that can be obtained easily from the Triangle of Pascal (Table 2);
where each number is equal to the sum of the two numbers placed over it.
In Table 2,  is the total number of lines and
  is the sum of each row of the Triangle of Pascal,
 (or total number of transitions).
Table 2:
Relative intensities for the lines generated by n nuclei with I = 1/2.
| n |
Relative intensities |
N |
Multiplet |
S |
| 0 |
|
|
|
|
|
|
|
|
1 |
|
|
|
|
|
|
|
|
1 |
Singlet |
1 |
| 1 |
|
|
|
|
|
|
|
1 |
|
1 |
|
|
|
|
|
|
|
2 |
Doublet |
2 |
| 2 |
|
|
|
|
|
|
1 |
|
2 |
|
1 |
|
|
|
|
|
|
3 |
Triplet |
4 |
| 3 |
|
|
|
|
|
1 |
|
3 |
|
3 |
|
1 |
|
|
|
|
|
4 |
Quartet |
8 |
| 4 |
|
|
|
|
1 |
|
4 |
|
6 |
|
4 |
|
1 |
|
|
|
|
5 |
Quintet |
16 |
| 5 |
|
|
|
1 |
|
5 |
|
10 |
|
10 |
|
5 |
|
1 |
|
|
|
6 |
Sextet |
32 |
| 6 |
|
|
1 |
|
6 |
|
15 |
|
20 |
|
15 |
|
6 |
|
1 |
|
|
7 |
Septet |
64 |
| 7 |
|
1 |
|
7 |
|
21 |
|
35 |
|
35 |
|
21 |
|
7 |
|
1 |
|
8 |
Octet |
128 |
| 8 |
1 |
|
8 |
|
28 |
|
56 |
|
70 |
|
56 |
|
28 |
|
8 |
|
1 |
9 |
Nonet |
256 |
Triangle of Pascal
;
(number of lines)

;
(number of transitions)

.
Figure 3:
Energy levels and the EPR spectrum of a radical with two equivalent nuclei with I = 1/2.
 |
The following subsections include, in increasing order of difficulty, a series of EPR spectra of radicals that have
n equivalent nuclei (n = 2, 3,  , 8) with spin .
In all the cases you must perform the following operations:
- Load the simulator program pressing the shown link.
- Measure the hyperfine splitting value in the experimental spectrum
(clicking with the mouse in the centre of the Lorenztian lines, the distance in mT between two consecutive
clicks will be shown on the screen).
- Use the measured value to simulate the spectrum.
- When you think that the simulation is correct, overlap both spectra (simulated and experimental)
and if you detect differences (they do not overlap correctly) refine the hyperfine splitting
and/or change the peak to peak linewidth (to see Appendix A).
- Measure the heights (clicking with the mouse) of each line and divide the result by the value of the first line
(for the radicals [a006] and [a007] is better to divide by the value of the second line since first one is very small).
- Observe the number of equivalent nuclei and the signals that they generate.
Compare the results obtained with the data from Table 2.
- Print out the simulated and experimental spectra with the parameters used for the simulation.
When you finish the simulation, close the window of the simulator to return to the tutorial.
Subsections
Next: 5.1.1 Hydroxymethyl neutral radical
Up: 5 Radical Spectra with
Previous: 5 Radical Spectra with
Contents
Universidad Autónoma de Madrid, Departamento de Química Física Aplicada