Next: 8.2 Radicals containing r
Up: 8.1 Radicals containing r
Previous: 8.1.10 Biphenyl anion radical
Contents
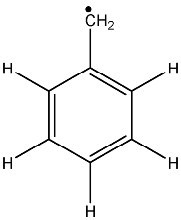
8.1.11 Benzyl neutral radical [a021]
Paying attention to the structure of this radical it should have four different hyperfine splittings
that will give
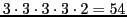 theoretical lines.
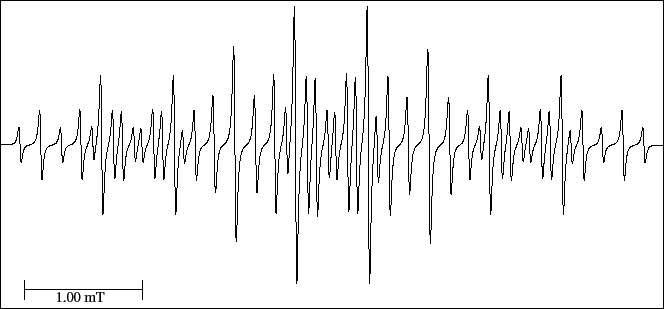
However, in the spectrum (Fig. 26) only 48 lines are observed
and the three first lines form a triplet (1:2:1).
The distance among the centre of the first and the centre of the second line corresponds to the smaller hyperfine splitting.
The difference between the number of theoretical and experimental lines (6 lines) can be explained because
there are two triplets situated symmetrically to each side of the spectrum and formed by lines
16, 17 and 18 (left part) and 30, 31 and 32 (right part) that overlap in position with other two triplets.
According to the successive splittings they would be 54/3 = 18 triplets with the smaller splitting.
Lines 2-6-12 form another triplet (2:4:2) and continuing with the diagram of splittings
they would give 18/3 = 6 triplets with the second hyperfine splitting.
Connecting the central lines of these triplets we obtain three doublets (6/2 = 3),
lines 6-13, 21-28 and 36-43 with a relation of heights 4:8:4, situated symmetrically in the spectrum,
which would give the third hyperfine splitting.
The centre of these doublets give a triplet (3/3=1), and consequently the greatest hyperfine splitting,
distance between lines 6 and 21 (or 1 and 16).
theoretical lines.
However, in the spectrum (Fig. 26) only 48 lines are observed
and the three first lines form a triplet (1:2:1).
The distance among the centre of the first and the centre of the second line corresponds to the smaller hyperfine splitting.
The difference between the number of theoretical and experimental lines (6 lines) can be explained because
there are two triplets situated symmetrically to each side of the spectrum and formed by lines
16, 17 and 18 (left part) and 30, 31 and 32 (right part) that overlap in position with other two triplets.
According to the successive splittings they would be 54/3 = 18 triplets with the smaller splitting.
Lines 2-6-12 form another triplet (2:4:2) and continuing with the diagram of splittings
they would give 18/3 = 6 triplets with the second hyperfine splitting.
Connecting the central lines of these triplets we obtain three doublets (6/2 = 3),
lines 6-13, 21-28 and 36-43 with a relation of heights 4:8:4, situated symmetrically in the spectrum,
which would give the third hyperfine splitting.
The centre of these doublets give a triplet (3/3=1), and consequently the greatest hyperfine splitting,
distance between lines 6 and 21 (or 1 and 16).
Figure 26:
EPR spectrum of the benzyl neutral radical.
 |
[Exercise]
Proceed like in previous examples:
- Load the simulator clicking on the corresponding link.
- Verify the horizontal scale (in mT) and keeping in mind the previous explanations on the interpretation,
measure the four hyperfine splittings.
- Fill out the table of couplings on the simulator and reload the spectrum.
If the interpretation is correct then the number of lines and the intensities should coincide with the
experimental spectrum.
- Measure the length of the experimental spectrum (between the lines 1 and 48).
Apply the Eq. (8) and if that length coincides with the experimental value then the interpretation is correct.
- Refine the hyperfine splitting values and/or the peak to peak linewidth (DHpp) by overlapping both spectra.
- When the simulation is correct, measure the heights of the lines 2, 6, 17 and 21 and write its value in
- Print out the results with the spectra simulated and experimental without overlap
and including the tree of splittings.
- Indicate on the tree of splittings the theoretical relative intensities of each multiplet originating
by the three larger constants.
An example of the assignment of intensities is presented in the interpretation of the radical [a018]
(section 8.1.2), Fig. 17.
- Mark with an arrow the lines 2, 6, 17 and 21 and write close to it its theoretical relative intensity.
- In the printed results, number the nuclei with spin of the molecule and assign, if possible, the protons that
originate thee hyperfine splittings.
Justify the answer.
- Complete the Table of intensities (tab-a021).
Next: 8.2 Radicals containing r
Up: 8.1 Radicals containing r
Previous: 8.1.10 Biphenyl anion radical
Contents
Universidad Autónoma de Madrid, Departamento de Química Física Aplicada